Agent-Based Model for Covid-19 Screening
Language: Java
Introduction
I created this project for a class I took at UNM called Complex Adaptive Systems by Melanie Moses. The course was fantastic! It just so happens that one of the topics of this class was the complexities of viruses and epidemic spread. Little did I know that a global pandemic was literally around the corner. When COVID-19 started to change the world, I was taking a class that pushed me to study it with more detail than I otherwise would.
At this time, no one understood anything about this virus. There were many people performing research on the topic. Almost none of it was peer-reviewed, so we built a research paper based on outstanding research, but ultimately no one knew the truth. At the time, the term asymptomatic was spreading across society. It was in everyone's vocabulary. This idea of an asymptomatic sick person spreading SARS-COV-2 was something my research partner, Anas Gauba, and I wanted to explore in detail. We knew we needed some Agent-Based Model (ABM) to explore these questions. While there exist some software packages made to build ABM's, we decided to build one from scratch using Java.
Using our own ABM, we explored the question: Can Testing More People Flatten the Curve?
Approach
When building our ABM to answer this question, we needed to make assumptions. This need is something that every model must do. It is just impossible to identify every variable that a model is simulating. This is especially true for a model of a complex system. We decided to focus on this idea of screening people. In our model, we make the following assumptions:
- We have an infinite amount of tests.
- Quarantining people over a uniformly distributed time and keeping them quarantined until they are no longer infected captures the CDC’s quarantine guidelines.
- There is a correlation between how sick someone is to how contagious they are. The more a person shows symptoms, the more contagious they are.
- There are more asymptomatic people compared to symptomatic people.
- The epidemic spreads while a person is inside their home community or leaves a public building such as grocery stores or restaurants.
- at_quarantine, which determines how many seconds a person stays in quarantine in a uniformly distributed manner.
- at_community, which determines how many seconds a person stays at their home community in a uniformly distributed manner.
- at_destination, which determines how many seconds a person stays at a building in a uniformly distributed manner.
- countdown_till_spread, which determines when to start the epidemic spread.
- symptom_scale_threshold, which determines what percent of people to test and quarantine.
In our model, every person gets what we call a symptom scale. This number determines how symptomatic they are based on a scale from 0 to 1 where if they have a 1 they will infect someone they come in contact with with a 100 percent chance. This variable is what we use to answer our main question. In reality, this number may be associated with age or an overall health profile of a person. Based on real-world data at the time, we used a Beta distribution with alpha = 2 and beta = 3.5 to determine what threshold to assign to every person. The tunable parameter symptom_scale_threshold is also a number between 0 and 1 and will quarantine all sick people with a symptom scale number above the threshold.
The idea behind the model is that everyone who shows a specific scale of symptoms gets screened on a consistent time interval. If they test positive for Covid-19, they are quarantined. So if the threshold were 0, then every person would get screened no matter their symptoms. Our model shows that during this unrealistic scenario, we would eliminate the epidemic.
If you look at the video at the top of this page, you will notice little dots with different colors. Each dot represents a person and their current state of either Susceptible, Infected, Recovered, and Quarantined. These dots are moving around a map. The grey boxes around the edge represent what we call communities. Each person is assigned one community. They will wander around their community for a while and then, after some time, will venture to a randomly selected yellow or blue box in the center. These yellow or blue boxes represent public buildings like a restaurant or a hospital. They wander around this building for some time before they go back home to their community.
The virus can spread either in the community or in a public building. If a susceptible person comes within a small radius of an infected person, the virus will infect them based on the infected person's symptom scale number. This simulates this idea of different contagion levels. If a susceptible person is inside a public building, they can get infected based on the max symptom scale number of all people in that building when they leave.
With all of the above built into the model, we now had everything we needed to implement different Symptom_scale_threshold numbers to see how we can impact the curve based on how we screen and quarantine based on the symptoms of the population.
Results
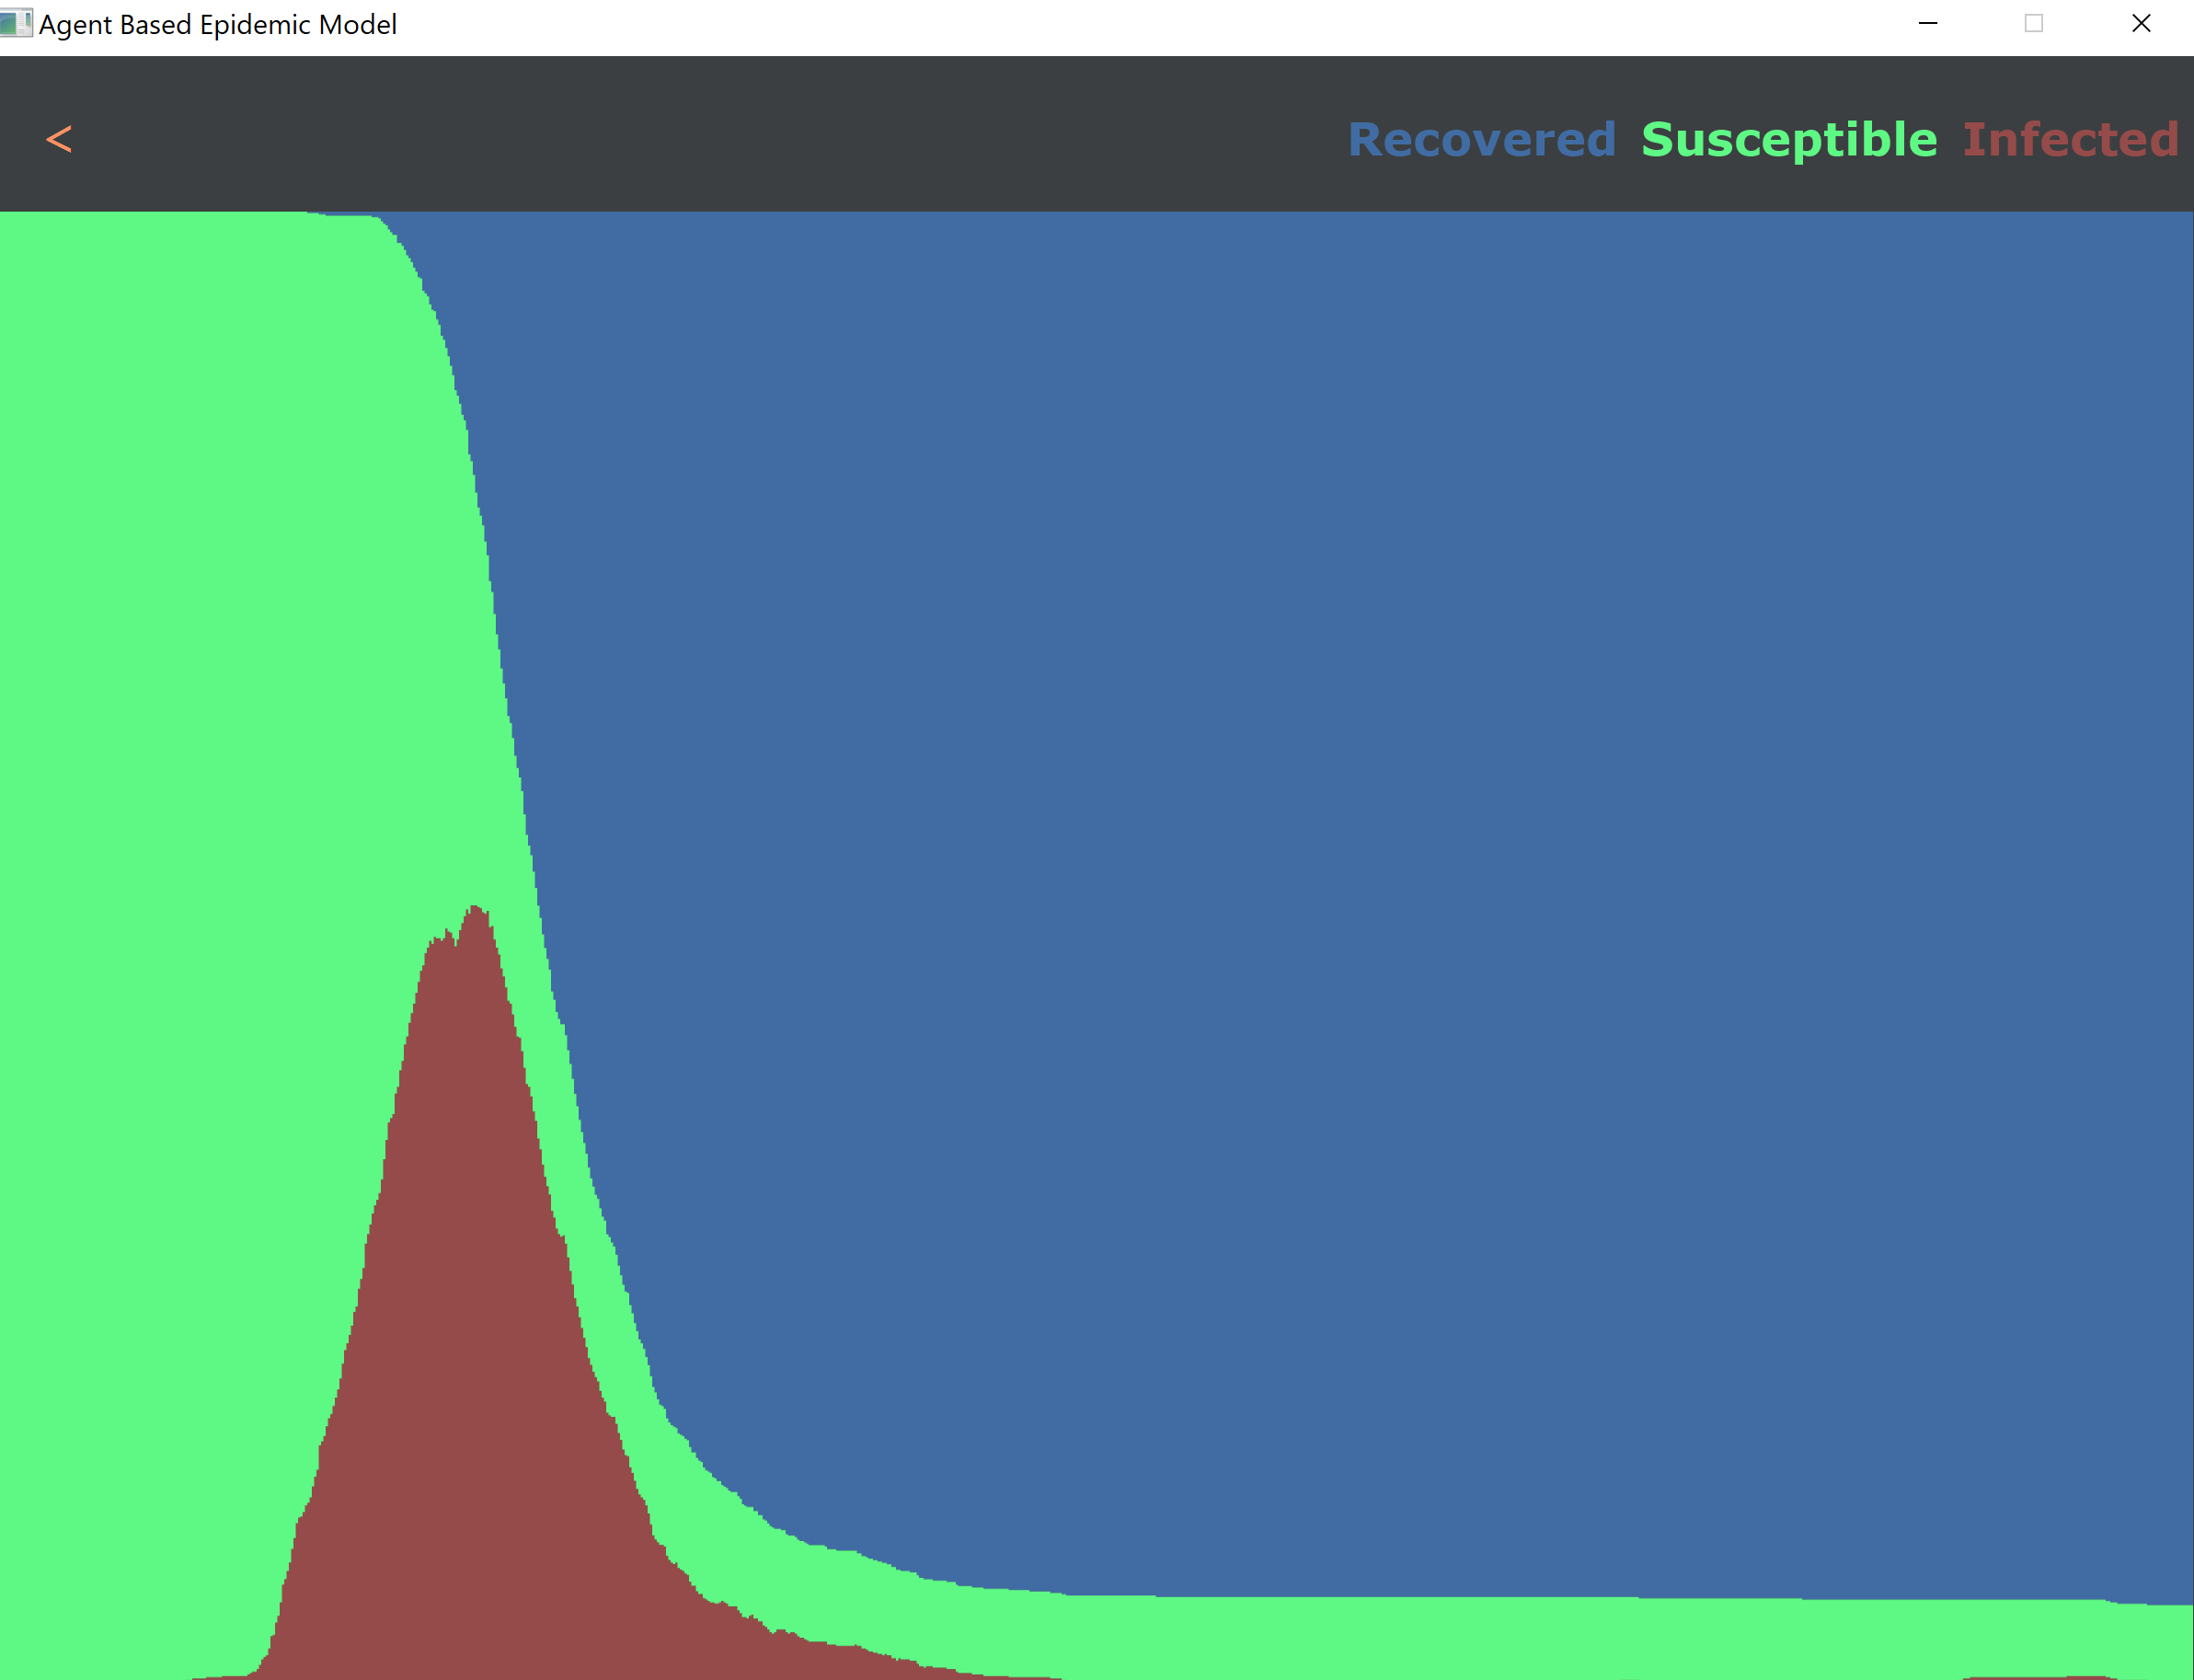
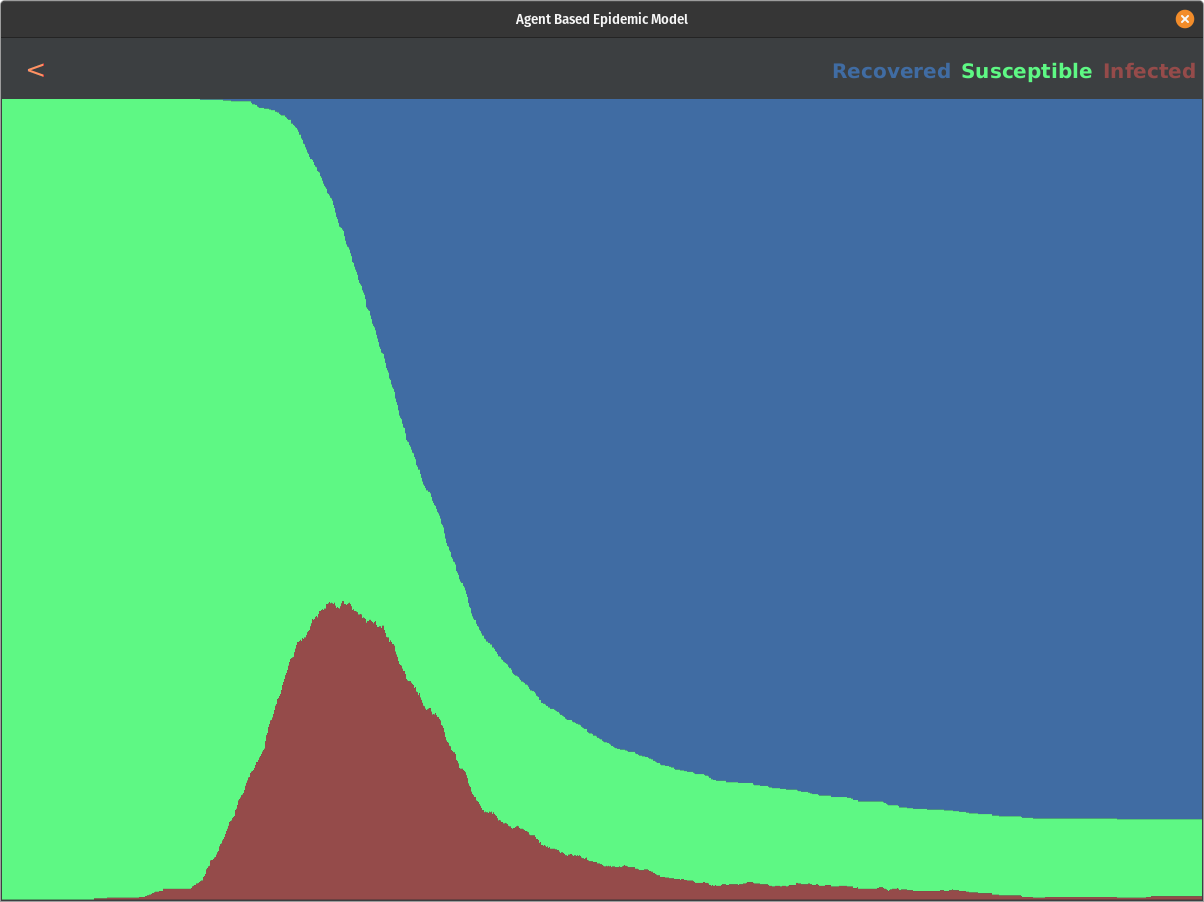
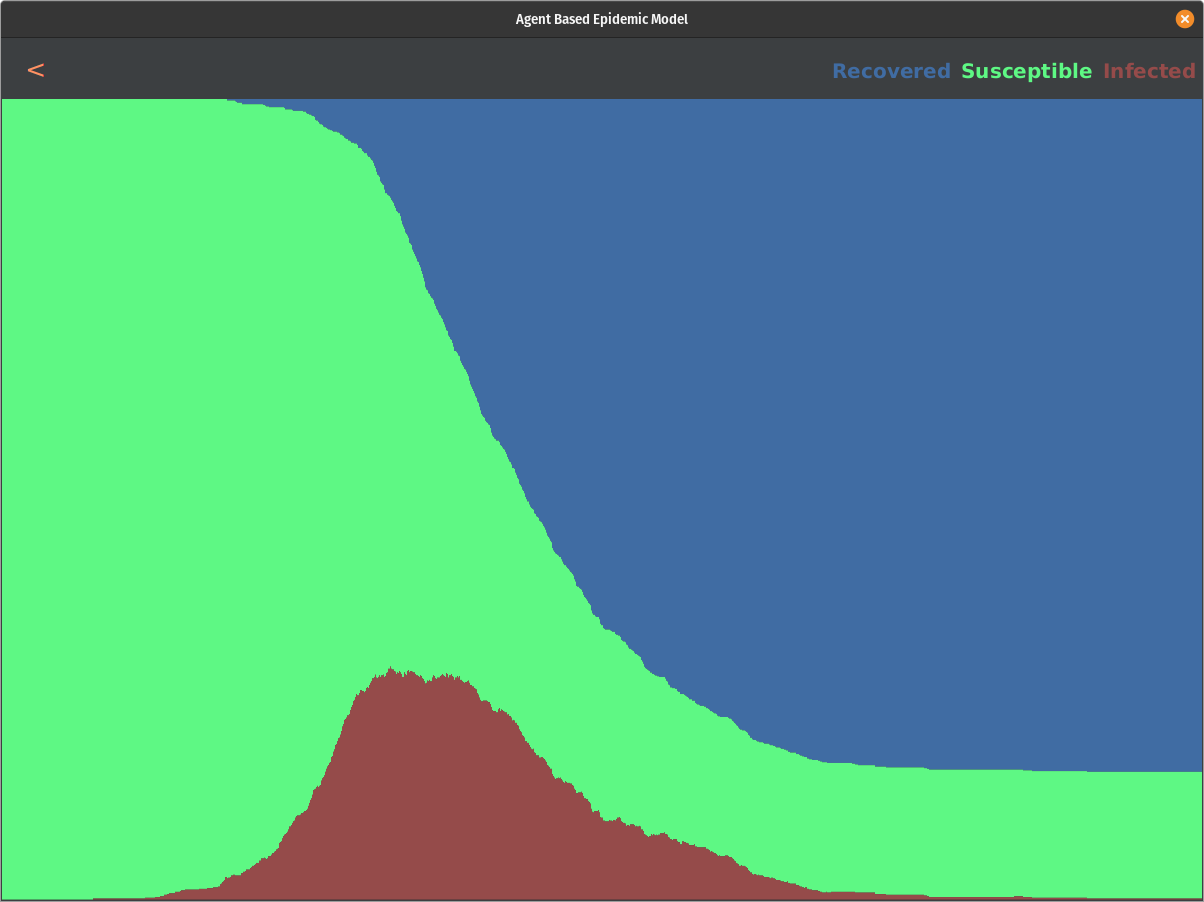
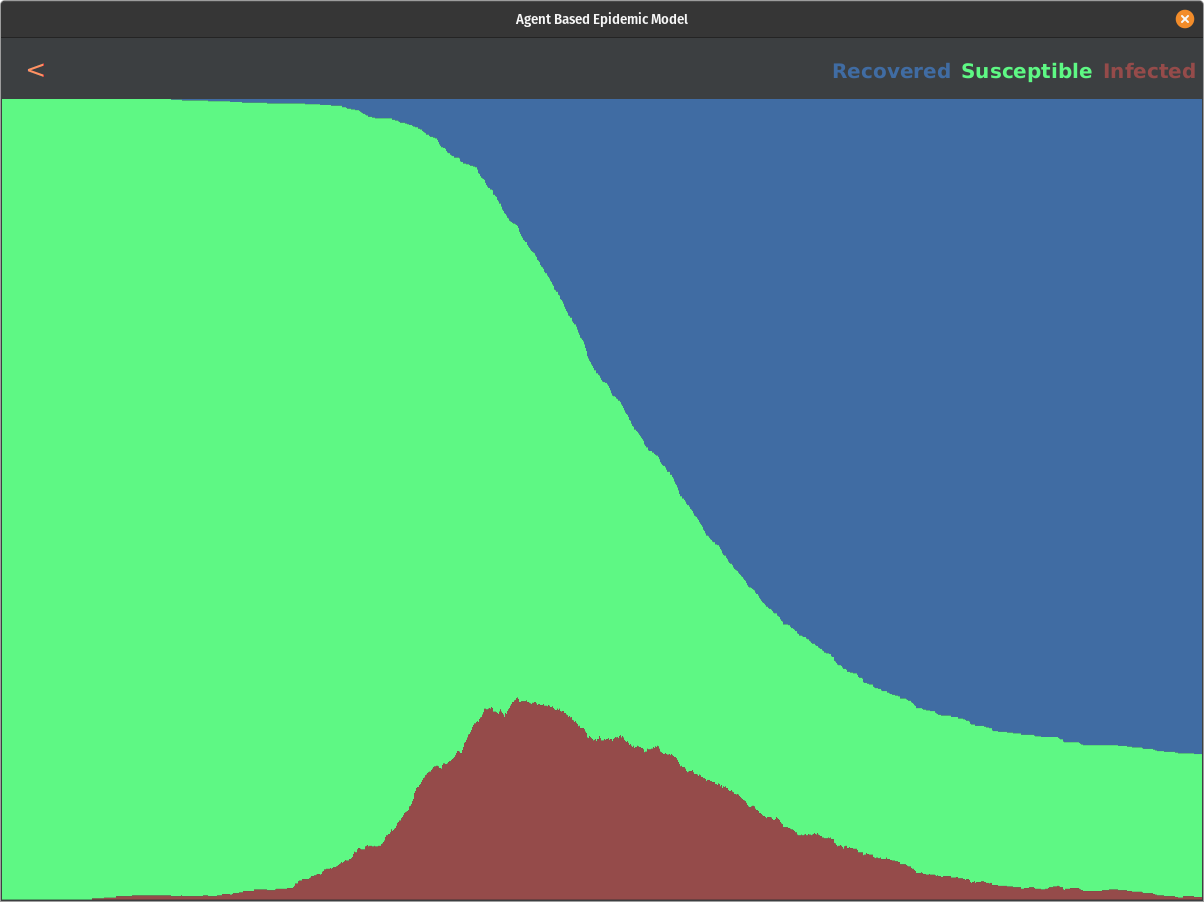
To answer our question, we ran our model with variable symptom_scale_threshold numbers. We started at 1.0 and decreased this by .1 each simulation afterward until we ran with a 0. This would allow us to analyze how increasing how many people we test affect the epidemic's outcome.
We start to see a slight impact on the curve for every run. We do not see a massive impact on the curve until we hit thresholds less than 0.5. If we test the population above the threshold of 0.1, we can eliminate the epidemic before it even starts. Here are some snapshots of the result:
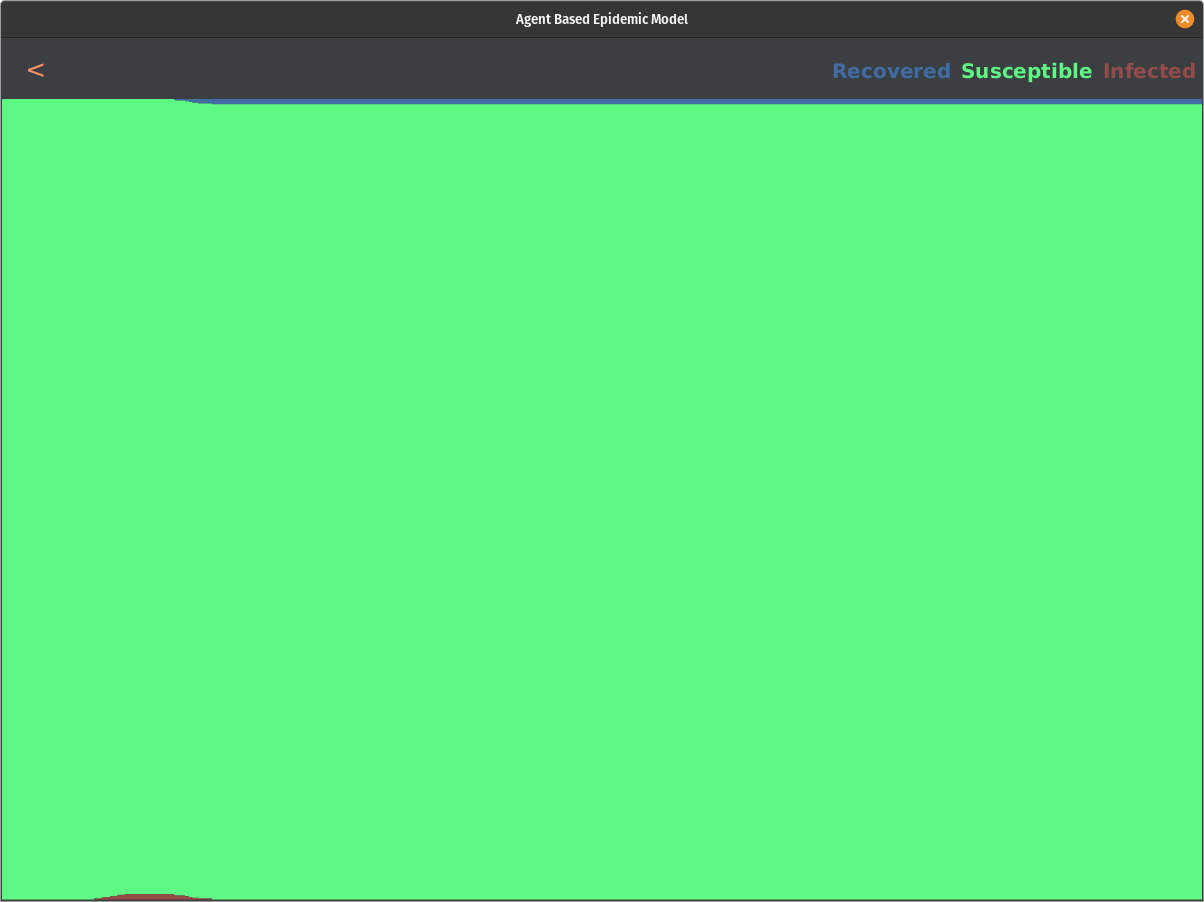
All in all, this model shows some interesting results. There is a direct correlation to how we can affect the curve by providing tests and responding accordingly to positive results. This is not a complete picture, though, and it raises some questions. What is the actual distribution of the symptom scale of this disease? Is it following beta distribution with alpha=2 and beta=3.5 or any other distribution? We may not know what the actual distribution looks like until this pandemic ends, but based on our research and data that was out there so far, this model showed promising results and answered the proposed question.
If you would like even more details from a research perspective, then please download our research paper pdf. There is a link above under the video. If you would like to play around with the ABM we made or even expand it, please look at the GitHub repo, which is also linked above.